Band depth
Here is an example on how to compute and display a band depth on an OMEGA observation using OMEGA-Py.
Let's assume that you have downloaded the OMEGA data cube ORB0979_2 from the PSA (or from these links: QUB, NAV) and loaded the module and data as follows:
Step 1 – Loading the data
Option 1: Load the binary files and apply the thermal and atmospheric corrections if needed.
# Load the data cube
omega0 = od.OMEGAdata('0979_2')
# Apply thermal and atmospheric corrections
omega = od.corr_therm_atm(omega0, npool=15)     # Adjust npool according to your system
Option 2: Load directly a previously saved OMEGAdata object
(with or without the corrections already applied).
# Load directly the already corrected data cube
omega = od.autoload_omega('0979_2', therm_corr=True, atm_corr=True)
Step 2 – Generating the data mask (optional)
mask = od.omega_mask(
    omega,
    hide_128=True,
    emer_lim=10,
    inci_lim=70,
    tempc_lim=-194,
    limsat_c=500
    )
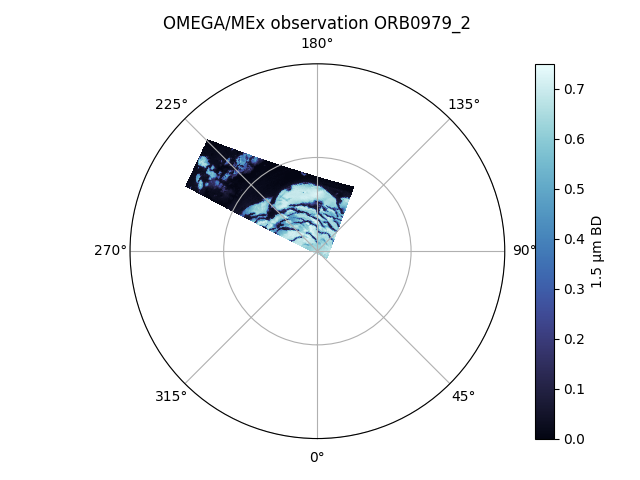
Step 3 – Computing band depth at 1.5 μm
Let's compute the water ice 1.5 μm band depth as defined in Poulet et al. (2007)1:
Source code for function BD_omega(omega, lam0, lamc1, lamc2, norm=True)
import omegapy.useful_functions as uf
import numpy as np

def BD_omega(omega, lam0, lamc1, lamc2, norm=True):
    """Compute the band depth on an OMEGA observation cube.
    Continuum linear between lamc1 and lamc2.

    If an array is passed as argument for a wavelength value, the average is used.

    Parameters
    ----------
    omega : OMEGAdata
        The OMEGA/MEx observation.
    lam0 : float or array-like
        The wavelength of the center of the band.
    lamc1 : float or array-like
        The wavelength of the bluer point for the continuum determination.
    lamc2 : float or array-like
        The wavelength of the redder point for the continuum determination.
    norm : bool, optional (default True)
        | True -> band_depth output is the normalized BD values.
        | False -> band_depth output is the BD values.

    Returns
    -------
    band_depth : 2D array
        The array of the band depth values for the observation
        (normalized or not depending on norm).
    rf_c : 2D array
        The value of the continuum used to measure the band depth.
    """
    if not omega.therm_corr:
        print("\033[01;33mWarning: No thermal correction applied.\033[0m")
    # Initialisation
    refl_cube = omega.cube_rf
    nx, ny, nlam = refl_cube.shape
    # Conversion floats -> list
    if isinstance(lam0, (int, float)):
        lam0 = [lam0]
    if isinstance(lamc1, (int, float)):
        lamc1 = [lamc1]
    if isinstance(lamc2, (int, float)):
        lamc2 = [lamc2]
    # Search for wavelength indexes
    i_lam0 = uf.where_closer_array(lam0, omega.lam)
    i_lamc1 = uf.where_closer_array(lamc1, omega.lam)
    i_lamc2 = uf.where_closer_array(lamc2, omega.lam)
    # Average wavelengths
    lam0 = np.mean(omega.lam[i_lam0])
    lamc1 = np.mean(omega.lam[i_lamc1])
    lamc2 = np.mean(omega.lam[i_lamc2])
    # Average reflectances
    rf_band = np.mean(refl_cube[:, :, i_lam0], axis=2)
    rf_c1 = np.mean(refl_cube[:, :, i_lamc1], axis=2)
    rf_c2 = np.mean(refl_cube[:, :, i_lamc2], axis=2)
    # Average continuum
    rf_c = rf_c1 + (rf_c2 - rf_c1) * (lam0 - lamc1) / (lamc2 - lamc1)
    # Compute BD over the OMEGA cube
    if norm:
        band_depth = (rf_c - rf_band) / rf_c
    else:
        band_depth = rf_c - rf_band
    # Output
    return band_depth
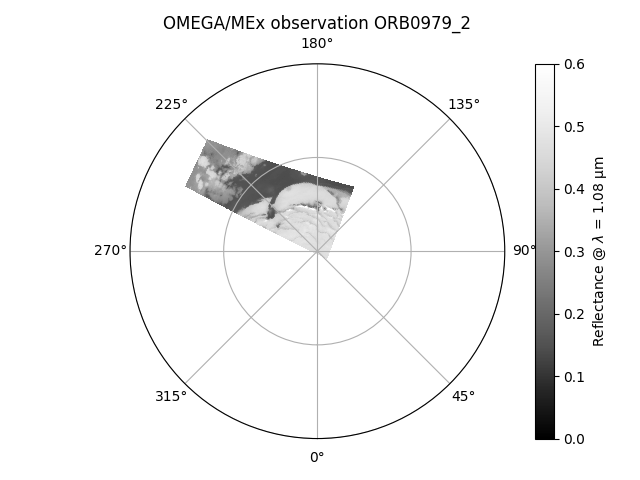
Step 4 – Displaying the band depth map
Now that we have computed the band depth map, we can display it with
the show_data_v2 function,
as described in the data visualization page.
Tip
Install and import the cmocean module to access some more nice colormaps:
-
F. Poulet, C. Gomez, J.-P. Bibring, et al. (2007). Martian surface mineralogy from Observatoire pour la Minéralogie, l'Eau, les Glaces et l'Activité on board the Mars Express spacecraft (OMEGA/MEx): Global mineral maps. JGR, 112, E08S02. doi:10.1029/2006JE002840 ↩